Performance Marketing Infrastructure
Unify Your Data.
Optimize Every Dollar Spent.
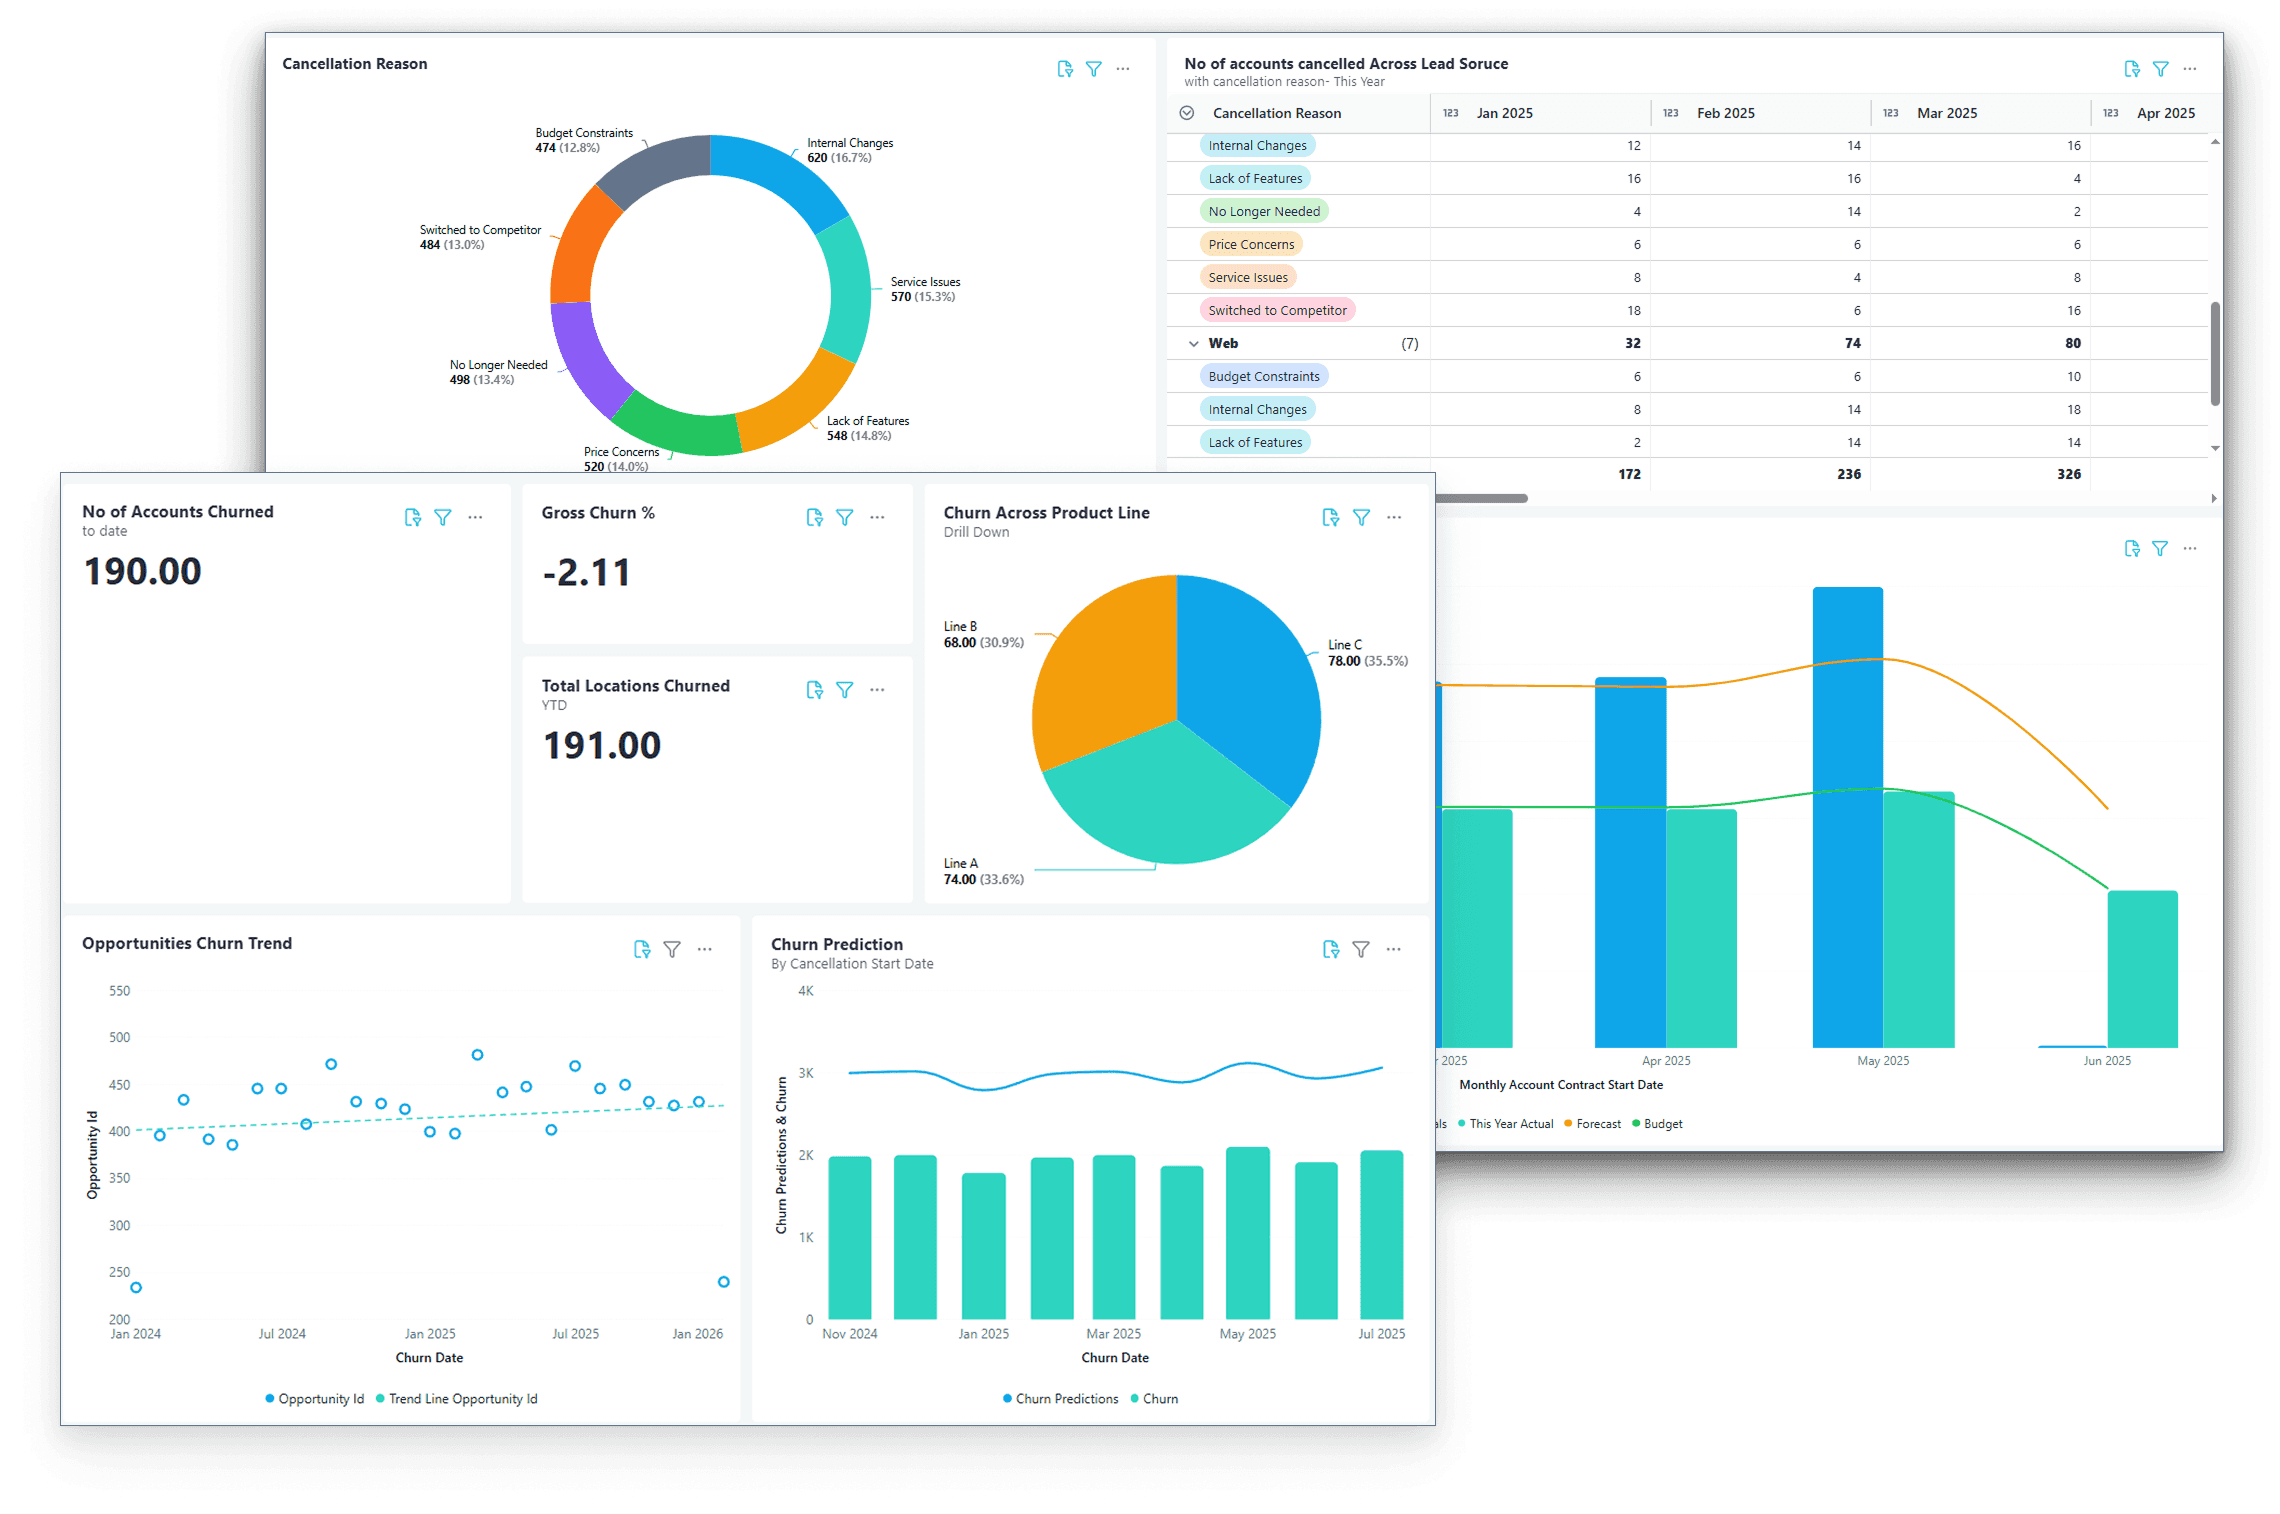
DataGOL unifies advertising spend, attribution, and in-app player behavior into one platform — giving you real-time insight into CAC, Lifetime Value, and ROAS.
Built for performance marketing leaders, DataGOL’s cohort-based and retention-driven modeling reveals not just what changed in your KPIs, but why, so you can acquire high-LTV customers efficiently and scale revenue with confidence.
Every metric is inspectable, traceable, and verified before it drives spend.
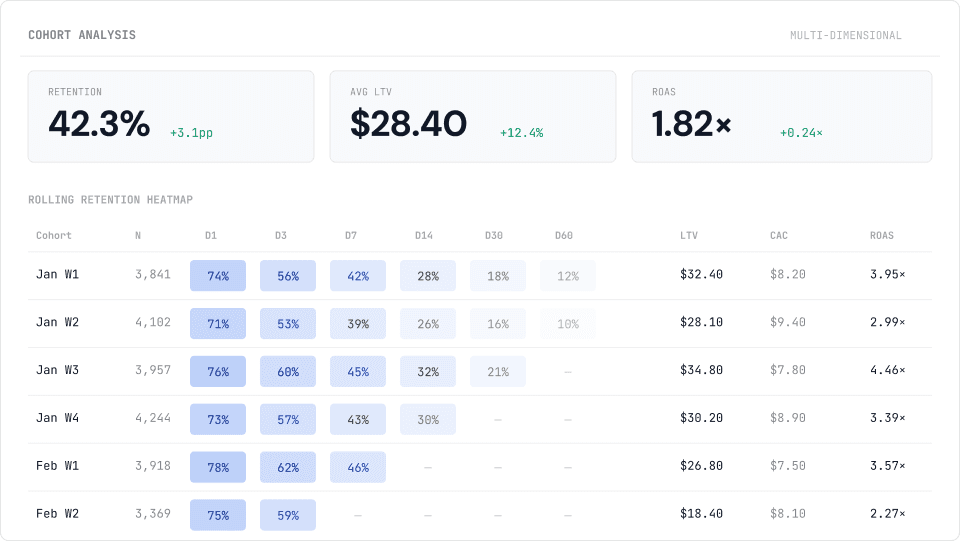
| COHORT | N | D1 | D3 | D7 | D14 | D30 | D60 | LTV | CAC | ROAS |
|---|---|---|---|---|---|---|---|---|---|---|
| Jan W1 | 3,841 | 74% | 56% | 42% | 28% | 18% | 12% | $32.40 | $8.20 | 3.95× |
| Jan W2 | 4,102 | 71% | 53% | 39% | 26% | 16% | 10% | $28.10 | $9.40 | 2.99× |
| Jan W3 | 3,957 | 76% | 60% | 45% | 32% | 21% | — | $34.80 | $7.80 | 4.46× |
| Jan W4 | 4,244 | 73% | 57% | 43% | 30% | — | — | $30.20 | $8.90 | 3.39× |
| Feb W1 | 3,918 | 78% | 62% | 46% | — | — | — | $26.80 | $7.50 | 3.57× |
| Feb W2 | 3,369 | 75% | 59% | — | — | — | — | $18.40 | $8.10 | 2.27× |
| SOURCE | N | RET | LTV | CAC | ROAS |
|---|---|---|---|---|---|
| Organic | 4,218 | 48.2% | $34.10 | $0.00 | ∞ |
| Paid Search | 8,924 | 38.6% | $26.80 | $12.40 | 2.16× |
| Social | 6,102 | 31.4% | $19.20 | $8.60 | 2.23× |
| Referral | 1,847 | 52.1% | $41.30 | $3.20 | 12.9× |
| 2,340 | 44.8% | $30.60 | $1.80 | 17.0× |
DataGOL Solution
01
Rigid Metrics & Black Boxes
Vendor tools define churn, retention, and
LTV for you. No way to adjust what
"active" means for your game. When a
formula changes upstream, your
numbers shift overnight and no one
knows.
You can't see what changed or what it
breaks downstream
02
Siloed Data:
Spend ≠ Revenue
Ad spend lives in Facebook, Google,
TikTok, Snapchat. Installs sit in AppsFlyer.
Revenue lives in your warehouse. No
legacy tool reliably joins spend →
install → revenue → retention.
Teams stitch spreadsheets instead of
optimizing campaigns
03
D30 retention showing 0% because the
cohort is only two weeks old? That's not
insight — it's noise. Traditional tools
count a player as churned just because
they took a break, destroying your
retention picture.
Leadership asks "why" and the
dashboard only shows "what"
DataGOL Solution
Built for Growth & ROI
DataGOL replaces those rigid, siloed tools with a goal-driven, cohort-centric analytics foundation. We align analytics to your core business goals – not generic vendor metrics – so you can finally measure and improve what really matters. Here’s how DataGOL solves the pain:
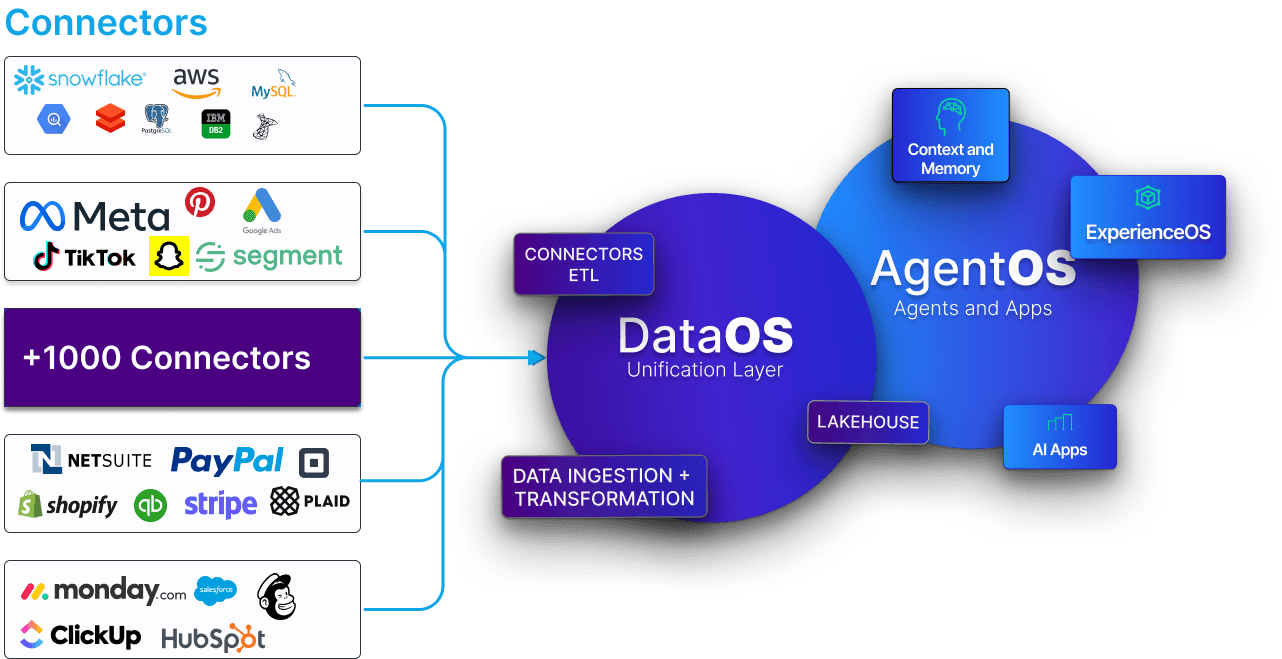
Unified Data Pipeline
All advertising, attribution, and in-game event data consolidated. Native connectors pull from every major ad platform and AppsFlyer continuously, preserving complete data with no 90-day API limits.
Analytics on Your Terms
Set the rules for churn, retention, ARPU, or LTV according to your game's realities. Every formula is transparent SQL you can inspect. No black boxes, no vendor lock-in.
Cohort-Centric Insight
Segment by any metric that matters. Multi-anchor cohorting shows acquisition quality, not just quantity.
Goal-Driven Metrics
Define funnels for each stage and see where drop-offs occur. Shift from chasing installs to acquiring valuable users
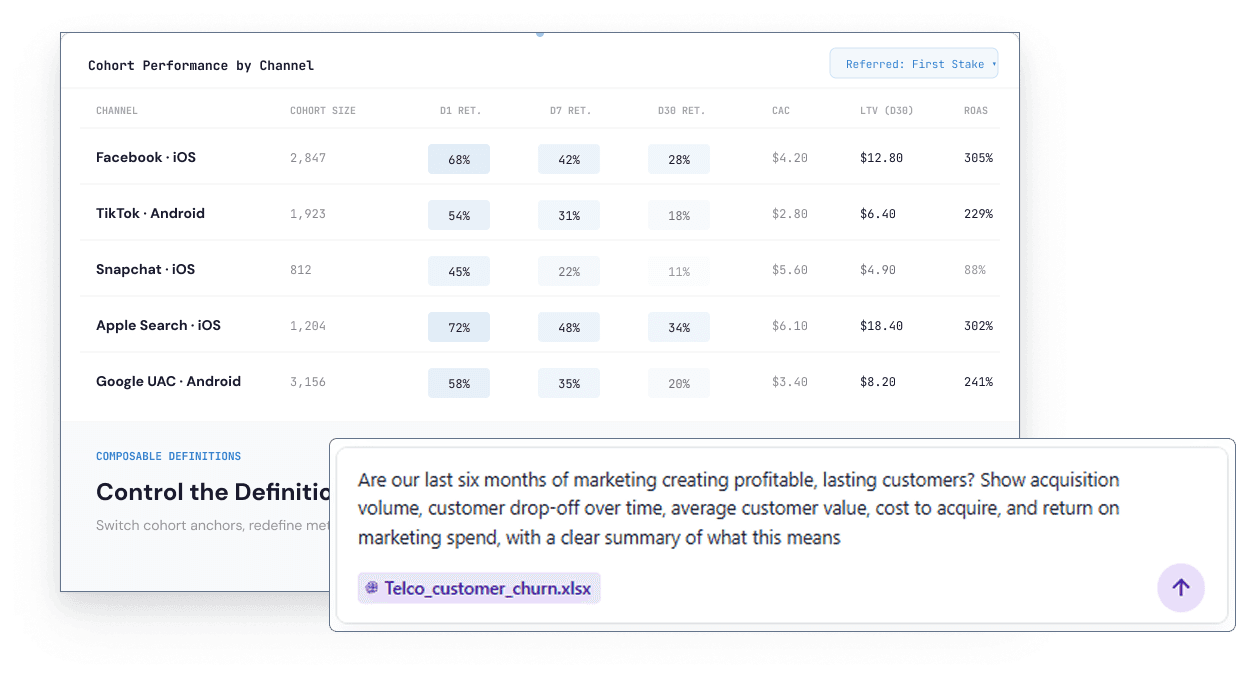
01 - CONTROL THE DEFINITION OF PROFIT
Your Game, Your Rules
Configure how key metrics are calculated — from what counts as "revenue" to how you define churn — all without code.
Multi-Anchor Cohorting
Segment by install, signup, first purchase, first stake, first deposit,
any meaningful milestone.
Rolling Retention
No false churn. Players aren't "lost" because they took a break, D7 retention reflects reality.
ROAS Payback Curves
See the break-even day by channel. Facebook pays
back by D7 while Snapchat takes till D30
CAC vs LTV Diagnostics
See cost in context of value. Cut
spend on sources that don't monetize
02 - UNIFIED PIPELINE
Spend → Install →
Revenue. Connected
All your advertising, attribution, and usage data consolidated into one governed pipeline. Native connectors pull from every major ad platform and AppsFlyer continuously:
Zero data loss across Facebook, Google, TikTok, Snapchat, Apple Ads
Automated quality checks — fresh analytics every morning, no manual pulls
One platform, one source of truth for all teams
03- MULTI-ANCHOR COHORTS
Cohorts Beyond
Install Date
Don't just ask "how many installed?"
Ask "how many became revenue producing user?" Segment by any milestone: install, signup, first key action, first revenue producing action.
Instantly see which campaigns produce high-LTV users versus just high volume.
Switch cohort anchor with one click — install, first stake, first deposit
See acquisition quality, not just quantity
Answer: "How long until new users start generating revenue?"
Launch faster. Ship smarter.
Win your category.
Join other forward-thinking businesses in harnessing the power of all-in-one platform.
START TODAY